There are three different answers you may want when asking a question like how to bet on college basketball.
- "I'm looking at Florida State -9.5 vs. UNC, and I have no idea what that means. Help."
- "I have a good idea of who I want to bet on, but I don't know where to do it."
- "I understand sports betting and have a sportsbook to bet at, but I want to sharpen my handicapping skills."
Below, we'll answer all three and much more.
How to Bet on College Basketball
What Does Any Of This Mean?
Let's use an example.
Florida State is a 9.5-point favorite over North Carolina.
PointsBet lists each bet type from left to right — spread, total, moneyline.

Florida State -9.5 (Point Spread): A point spread is the great equalizer in sports betting. It's a bet on the margin of victory in a game, adjusted for each team's ability.
Florida State was a -9.5 favorite over UNC, meaning FSU needs to win by 10 points or more for you to win your bet if you backed the Seminoles. That minus sign indicates FSU is favored.
If you bet UNC +9.5, you need the Tar Heels to lose by fewer than nine points or win the game to win your bet. The plus sign means Carolina is an underdog.
Over/Under 144.5 (Total): Outside the point spread, the next most popular betting option for college basketball is the total, also known as an over/under.
Here, you're simply wagering on how many points the teams will combine to score.
Based on each team's offensive and defensive efficiency, pace and more, the betting market expects about 144-145 points in this game.
North Carolina +380, FSU -500 (Moneyline): The point spread is a great equalizer, but the moneyline judges the teams in a similar way. But only winning the game straight-up matters, and it's priced accordingly.
If you think North Carolina can win this game outright, you'll get paid $3.80 for every $1 risked because the Tar Heels were listed at +380 (since they were far worse than FSU at this time).
A $10 bet would pay $38, plus the original $10 back.
If you want to back Florida State to just win straight-up at -500, you need to risk $5 for every $1. So a $50 bet will pay $10 (plus your $50 back).
Finding a Place to Bet
Full online sports betting is available in almost 20 states now.
- Full list of states with online betting
- Our favorite sportsbooks
- Tracking the status of states without legal betting
Handicapping College Basketball
OK, here's the fun part. You've bet on college basketball before, but you want to get better.
Let's first break down how point spreads are created in college hoops.
Offensive and Defensive Efficiency
The easiest place to start is with points per 100 possessions, both on offense and defense. It gives us a better picture of a team's ability in a vacuum. Raw stats like points per game are influenced too much by pace.
Once they have a baseline for efficiency, sites like KenPom.com or BartTorvik.com will calculate adjusted efficiency numbers that account for both pace and opponent ability.
Those sites will also project every final score for every game using those efficiency metrics.
Oddsmakers and the betting market have been using these statistical projections for a long time, though, and usually aren't too far off (unless there's an injury or some new information, which those sites don't account for).
Efficiency numbers need building blocks, though. That leads us to the Four Factors.
If you're using your own models, you can weigh statistics differently, put more or less emphasis on recent form, bake in shooting regression and more.
The Four Factors
How do basketball teams win games? There are four key contributors. First coined by Dean Oliver, the Four Factors and their weights are:
- Shooting (40%)
- Turnovers (25%)
- Rebounding (20%)
- Free Throws (15%)
KenPom.com popularized the Four Factors in college basketball, which evolved to:
- Effective Field Goal% (same as FG%, but 3-pointers are worth 50% more)
- Turnover Rate (turnovers/possessions)
- Offensive Rebounding Rate (OR / (OR + DR chances)
- Free Throw Rate (FT Attempts/FG Attempts)
I'm partial to teams that can shoot in modern basketball, so I tend to weigh effective field goal percentage more than the other factors.
Finding Mismatches
Using the Four Factors above, you can find mismatches within a game.
Let's take a look at this game between Texas A&M and Missouri.
There are mismatches all over the place, but two stand out:
- The ability of each defense to force turnovers against a turnover-prone offense.
- Missouri's shot suppression on defense vs. A&M's anemic shooting offense.
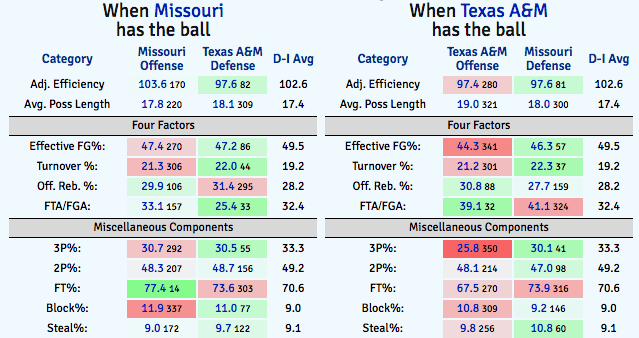
KenPom's projected total for this game was just 121 — a 61-60 Missouri win — so the fact that these are two turnover-prone teams on offense isn't some secret. But there are still situations where mismatches can help a bettor, or where the market is underestimating their impact.
Recent Form
BartTorvik.com is my favorite place to find a team's current form. And it's free!
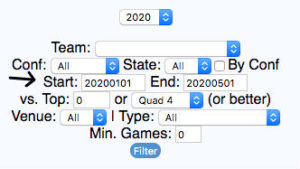
Using filters at the top, you can view all efficiency stats for every team over your set time frame. Comparing recent form to full-season statistical profiles can be a good way to find undervalued and overvalued teams in the betting market.
The time ranges also allow you to back-test easily.
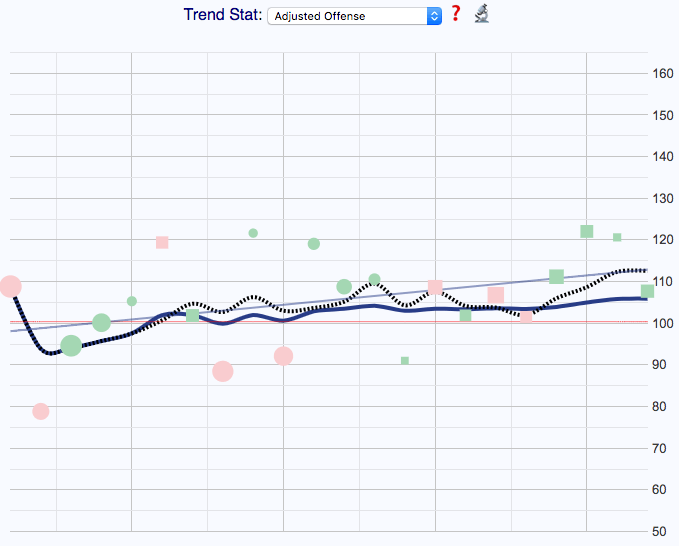
Within the team pages, you can see charts that show statistics for each team over time. The blue line is the moving average, the dashed line is the 5-game moving average, while the red and green plot points are individual games.
This is Boise State's offensive efficiency over time in 2019-20. The Broncos have been great in the last few weeks, indicated by the above-average plot points and rising 5-game moving average.
With So Many Games, Where Do You Start?
Pick a Niche
It's impossible to handicap and follow all 353 Division I teams, so specializing in a few conferences is a good idea for both your bankroll and sanity.
Limits might be smaller on the "extra games" offered by sportsbooks, but you can still get several hundred dollars down per game. Don't worry about hitting limits until you're winning consistently.
It's not easy to find information on Southland Conference injuries, for example. If you can follow the right people on Twitter and truly know a conference, it's incredibly valuable.
Rely on Tools
Again, you can't follow every team. You just can't. So using data is imperative.
The first type of data you should use is the projection systems I mentioned above. They'll give you a baseline for a team's true ability.
The second type of data is our public betting data, PRO Report and Bet Labs systems. The public betting data will give you insights into sharp money and overvalued teams, while Bet Labs has thousands of historical college basketball games that you can use to create gainful betting systems.
Our PRO Report highlights games that are standing out according to our systems, expert picks, projections and sharp action.
Track Your Progress
You'll never refine your handicapping without tracking it. You can use the Action Network app to log all your bets.
I'd also suggest tracking Closing Line Value in an Excel doc or Google Sheet. The more often you're getting the best of the number, the more likely you'll be successful, and you can get CLV in small-conference college basketball if you're betting early.
Mistakes to Avoid
Thinking You Know Everything
If a betting line is way off from your projection, don't blindly assume you're right and the rest of the market is wrong. A lot of other smart people have looked at the price, and decided it was right.
Dig in and try to find some answers as to why things are so different.
Short-Term, Small-Sample Trends
This applies to all sports. Any trend not rooted in a large sample is probably just noise. Kansas being 4-1 ATS in its last five games is not predictive.
Don't Overextend Yourself
There are more than 150 games on a loaded college basketball Saturday, and it's easy to lose big if you're betting too many games. By specializing in a few conferences, it's much more manageable and you won't end up losing your bankroll on a bad day.
Resources and Links
Here are some more sites to check out.
- Action PRO: Highlights proven signals from our projections, expert picks, systems and sharp action.
- KenPom.com. The original college basketball analytics resource. It costs $20 per year, but is well worth it.
- BartTorvik.com. Similar to KenPom, but free.
- Hoop-Math.com. They have a free and paid plan, but the free version has some interesting statistics on transition style and efficiency, shot selection and more.
- Massey Composite. Compiles more than 40 ratings systems.
- Haslametrics. Automated team capsules highlight mismatches that can be useful for betting.
- Sports Insights Injuries: Finding and tracking injuries in college basketball is difficult, so we've tried to make it a little easier.


