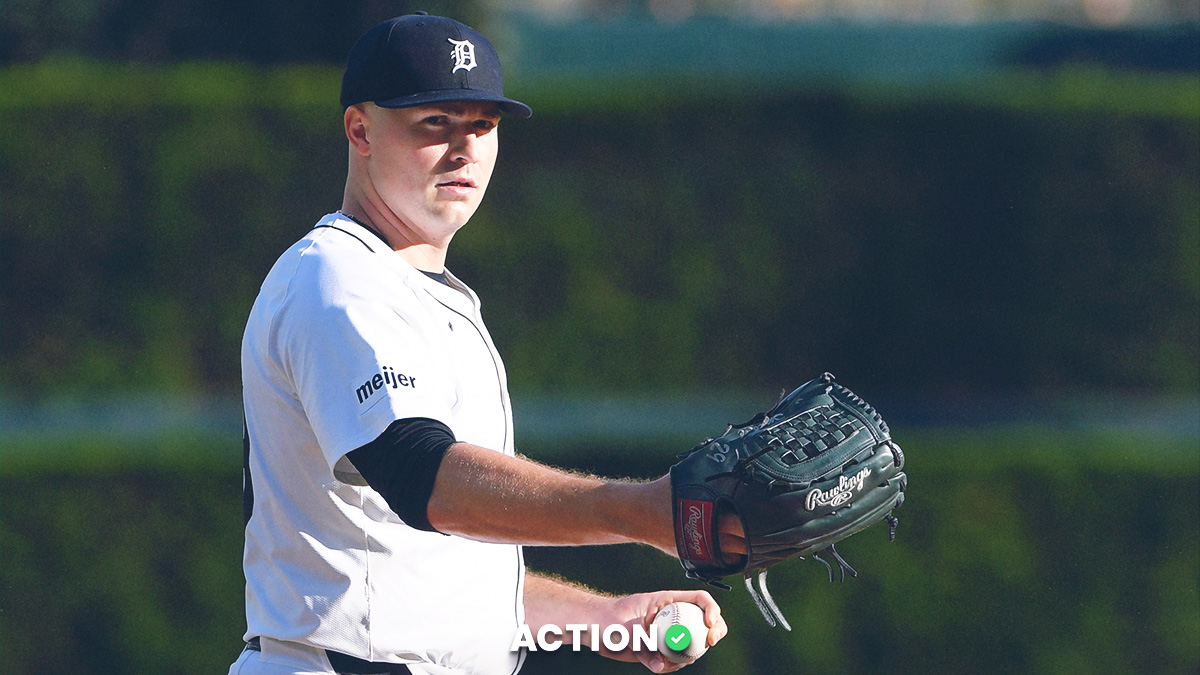
Tigers vs. Royals Odds & Betting Predictions - September 18, 2024
Tigers at Royals
11:40 pm • BSDETStarting Pitchers
| pitcher | team | era | w-l | |
|---|---|---|---|---|
 | 4.54 | 9-9 | ||
 | 2.39 | 18-4 |
Tigers at Royals Odds
Spread, Total, Moneyline
MatchupOpenSpreadTotalMoneyline | ||||
|---|---|---|---|---|
Tigers 4-4 | -1.5+120 | o8-105 | -135 | |
Royals 0-0 | +1.5-142 | u8-115 | +114 | |

Kauffman StadiumKansas City
Tigers vs. Royals Expert Picks
Ryan Minion
Last 30d: 210-256-5 (-38.8u)
B.Witt o1.5 Total Bases-125
$1.00
Top Shelf Action 🥃
Last 30d: 138-148-0 (-24.6u)
Under 8-110
0.91u
#ProSystem
. good strikeout pitchers take the under
Overall: 317-200-21,61% (ROI:18%)
Season:31-14-4,69% (ROI:31%)
. Contrarian Unders for Winning Teams
Overall: 412-280-28,60% (ROI:16%)
Season:20-14-1,59% (ROI:14%)
Picks Office
Last 30d: 204-146-1 (+45.7u)
KC +120
1u
Follow On X: https://x.com/PicksOffice
The Royals hold a better overall record of 82-70 compared to Detroit's 79-73 and show strong performance at home, going 45-32 this season. Kansas City starter Alec Marsh has been solid lately, posting a 3.52 ERA in his last three games, including an impressive 5.1-inning outing on 9/13/24, where he struck out 11 and allowed just 1 earned run. This performance highlights his good form coming into this matchup, which should continue against a Detroit offense that ranks lower in several key categories.
Kansas City’s offensive strength is another advantage, as they boast a higher team batting average (.249) than Detroit (.232). The Royals are more efficient at converting baserunners into runs, with a runs per game average of 4.84, compared to Detroit’s 4.29. The Royals also have a higher slugging percentage (.415 vs. .387), indicating better power, and a superior stolen base success rate of 81% versus Detroit's 76.8%, which adds an extra layer of offensive pressure. At home, Kansas City is batting an even better .266 against right-handed pitchers, and although Detroit’s starter Tarik Skubal is a lefty, the Royals have shown an ability to handle his pitching. In recent matchups this season, Skubal has struggled against Kansas City, allowing 5 earned runs in 6.1 innings on 8/2/24 and 4 earned runs in 5 innings on 5/22/24. Kansas City’s familiarity and past success against Skubal could again factor into the outcome, as their lineup has consistently found ways to score runs against him.
On the pitching side, Kansas City’s starters hold a slight edge over Detroit, with a 3.54 ERA compared to Detroit’s 3.70, and their bullpen remains solid with a 3.85 ERA. Detroit’s offense will likely have trouble generating significant run production against a Kansas City staff that is better at stranding baserunners, with a left-on-base ratio of 1.67:1, compared to Detroit’s 1.57:1. Given the Tigers’ lower batting average, run production, and familiarity issues with Alec Marsh, Kansas City has the pitching advantage, especially with Marsh showing a solid trend of limiting opponents' scoring opportunities recently.
Chase Holden
Last 30d: 0-0-0 (+0.0u)
KC +114
1u
Billy Ward
Last 30d: 6-6-0 (+2.5u)
Under 0.5 (1st Inn)-125
1.25u
Cam Is Money
Last 30d: 56-68-3 (-17.8u)
DET -0.5 (F5)+100
1u
Boomer Betz
Last 30d: 79-94-0 (-30.3u)
KC +132
1u

Sean Zerillo
Last 30d: 30-39-0 (-0.2u)
KC +132
0.5u
Bet to +125
PRO Insights

Tigers
DET Insights
- Featured Insight

TRY FOR FREE
Royals
KC Insights
- Featured Insight
 Royals have allowed a run just 26% of the time after an opposing score this season -- lowest in MLB. The Tigers have answered-back in just 24% of innings after an opponent scores this season -- third lowest in MLB.
TRY FOR FREE
Tigers vs. Royals Previews & Analysis
Prop Odds Comparison
Line Movement Tracker
Tigers vs. Royals Public Betting Percentages
Betting Trends
- Royals are 3-2 in their last 5 games.
- Royals are 3-2 in their last 5 games against the spread
- Royals are 44-37 in their road games against the spread
- The totals have gone OVER in 2 of Royals' last 5 games
- The totals have gone OVER in 31 of Royals' 81 last games at home
Matchup History
Against the Spread (ATS) History
Over/Under History
Last 5 Matchups
Royals vs. Tigers Injury Updates

Royals Injuries

Tigers Injuries
- Reese OlsonSP
Olson is out with shoulder
Out
- Ty MaddenSP
Madden is out with shoulder
Out
Tigers vs. Royals Box Score
 Tigers Player Stats
| PITCHER | PC | IP | K | ER | |
|---|---|---|---|---|---|
 | 95 | 5 | 7 | 1 | |
 | 29 | 2 | 3 | 1 | |
 | 13 | 1.1 | 0 | 0 | |
 | 9 | 0.2 | 1 | 0 |
| HITTERS | H-AB | R | HR | RBI |
|---|---|---|---|---|
 | 1-5 | 0 | 0 | 0 |
 | 0-2 | 0 | 0 | 0 |
 | 0-1 | 0 | 0 | 0 |
 | 0-1 | 0 | 0 | 0 |
 | 1-4 | 0 | 0 | 0 |
 | 1-5 | 1 | 1 | 1 |
 | 0-2 | 1 | 0 | 0 |
 | 1-2 | 1 | 0 | 0 |
 | 0-2 | 0 | 0 | 0 |
 | 0-2 | 0 | 0 | 0 |
 | 0-3 | 1 | 0 | 0 |
 | 0-3 | 1 | 0 | 0 |
 | 1-4 | 0 | 0 | 2 |
 | 2-4 | 0 | 0 | 0 |
 Royals Player Stats
| PITCHER | PC | IP | K | ER | |
|---|---|---|---|---|---|
 | 73 | 2.2 | 5 | 3 | |
 | 40 | 3.1 | 4 | 0 | |
 | 18 | 1 | 1 | 0 | |
 | 11 | 1 | 2 | 0 | |
 | 20 | 1 | 1 | 0 |
| HITTERS | H-AB | R | HR | RBI |
|---|---|---|---|---|
 | 1-4 | 1 | 0 | 0 |
 | 1-3 | 1 | 0 | 0 |
 | 2-4 | 0 | 0 | 1 |
 | 0-3 | 0 | 0 | 0 |
 | 0-0 | 0 | 0 | 0 |
 | 0-1 | 0 | 0 | 0 |
 | 0-1 | 0 | 0 | 0 |
 | 2-3 | 0 | 0 | 1 |
 | 0-4 | 0 | 0 | 0 |
 | 0-2 | 0 | 0 | 0 |
 | 1-2 | 0 | 0 | 0 |
 | 1-2 | 0 | 0 | 0 |
 | 0-4 | 0 | 0 | 0 |
 | 0-1 | 0 | 0 | 0 |
 | 0-2 | 0 | 0 | 0 |
 | 0-2 | 0 | 0 | 0 |
Tigers vs. Royals Odds Comparison
Could not load odds
Tigers at Royals Team Totals
MatchupOverUnder | ||
|---|---|---|
Tigers 4-4 | N/A | N/A |
Royals 0-0 | N/A | N/A |


